
Projecting Human Mobility and Disease Data to Support Decision-Making
Welcome!
Slides: https://fernandez-lab-wsu.github.io/geocovid-slides/slides.html

This material is licensed under a Creative Commons Attribution 4.0 International License.
Disclaimer ⚠️
This talk is about research software development
Eco-epidemiology of Zoonotic Diseases Lab
Washington State University
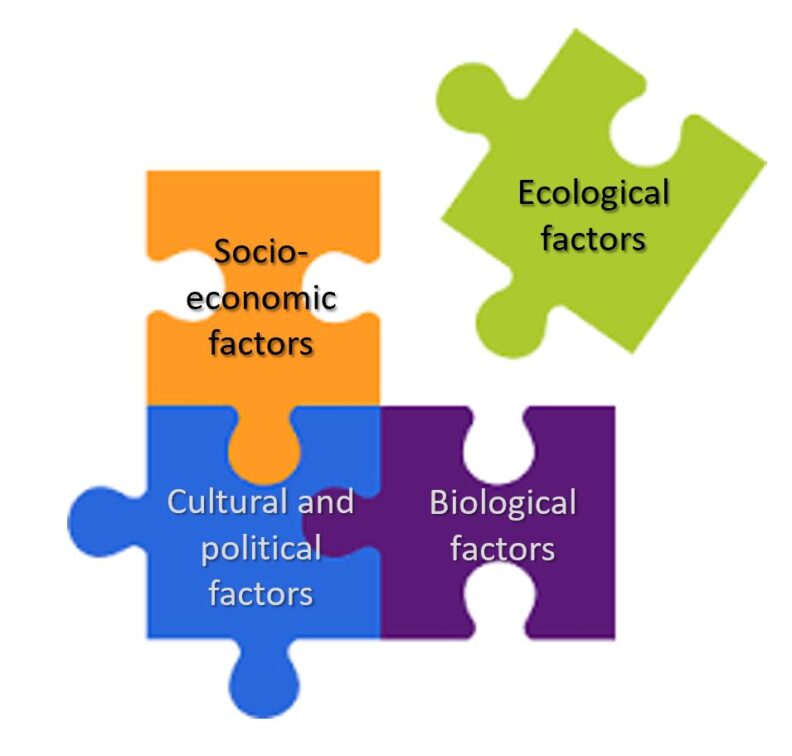
System thinking approach to integrate the human and ecological components that determines the emergence and persistence of zoonotic diseases.
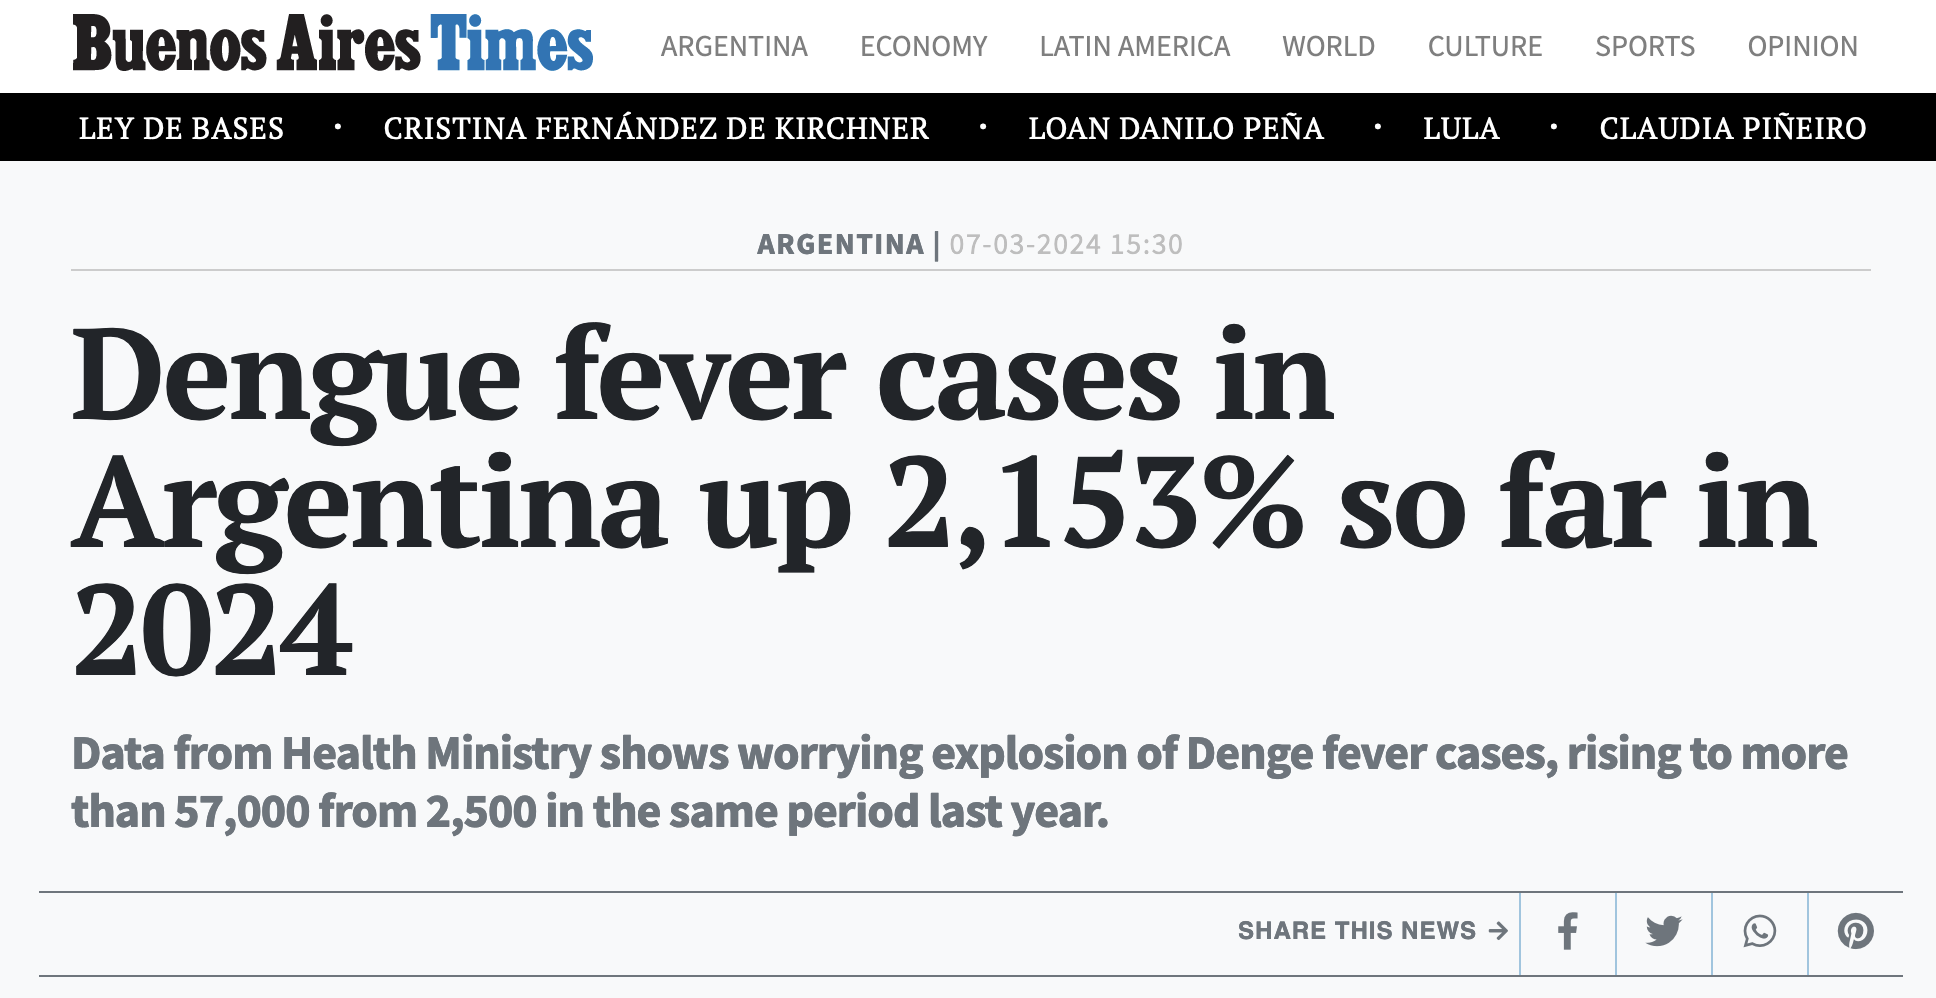
COVID-19
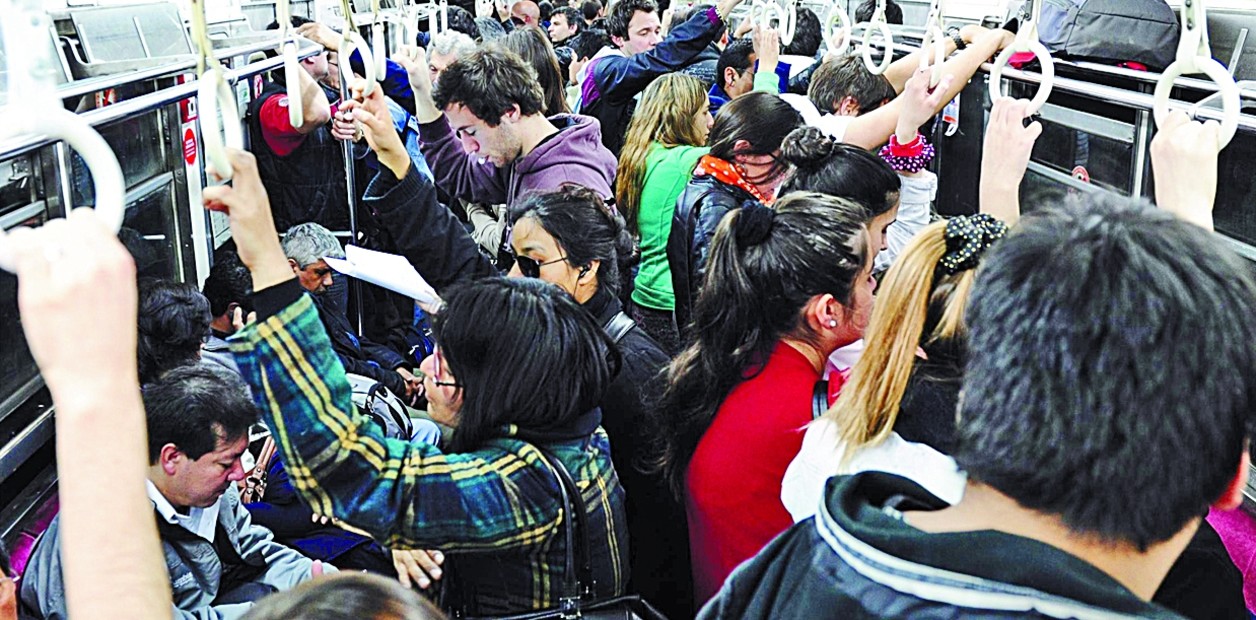
The human behavioral component is recognized as an influential factor in virus dispersion
Map how human mobility changes in space depending on the quarantine and how that correlated with COVID-19 cases.
🇦🇷 Argentina ➡️ Strict quarantine
What data can we use to analyze citizen mobility in the territory?
Meta/Facebook Mobility Data is available to researchers through the Data4Good Partner Program
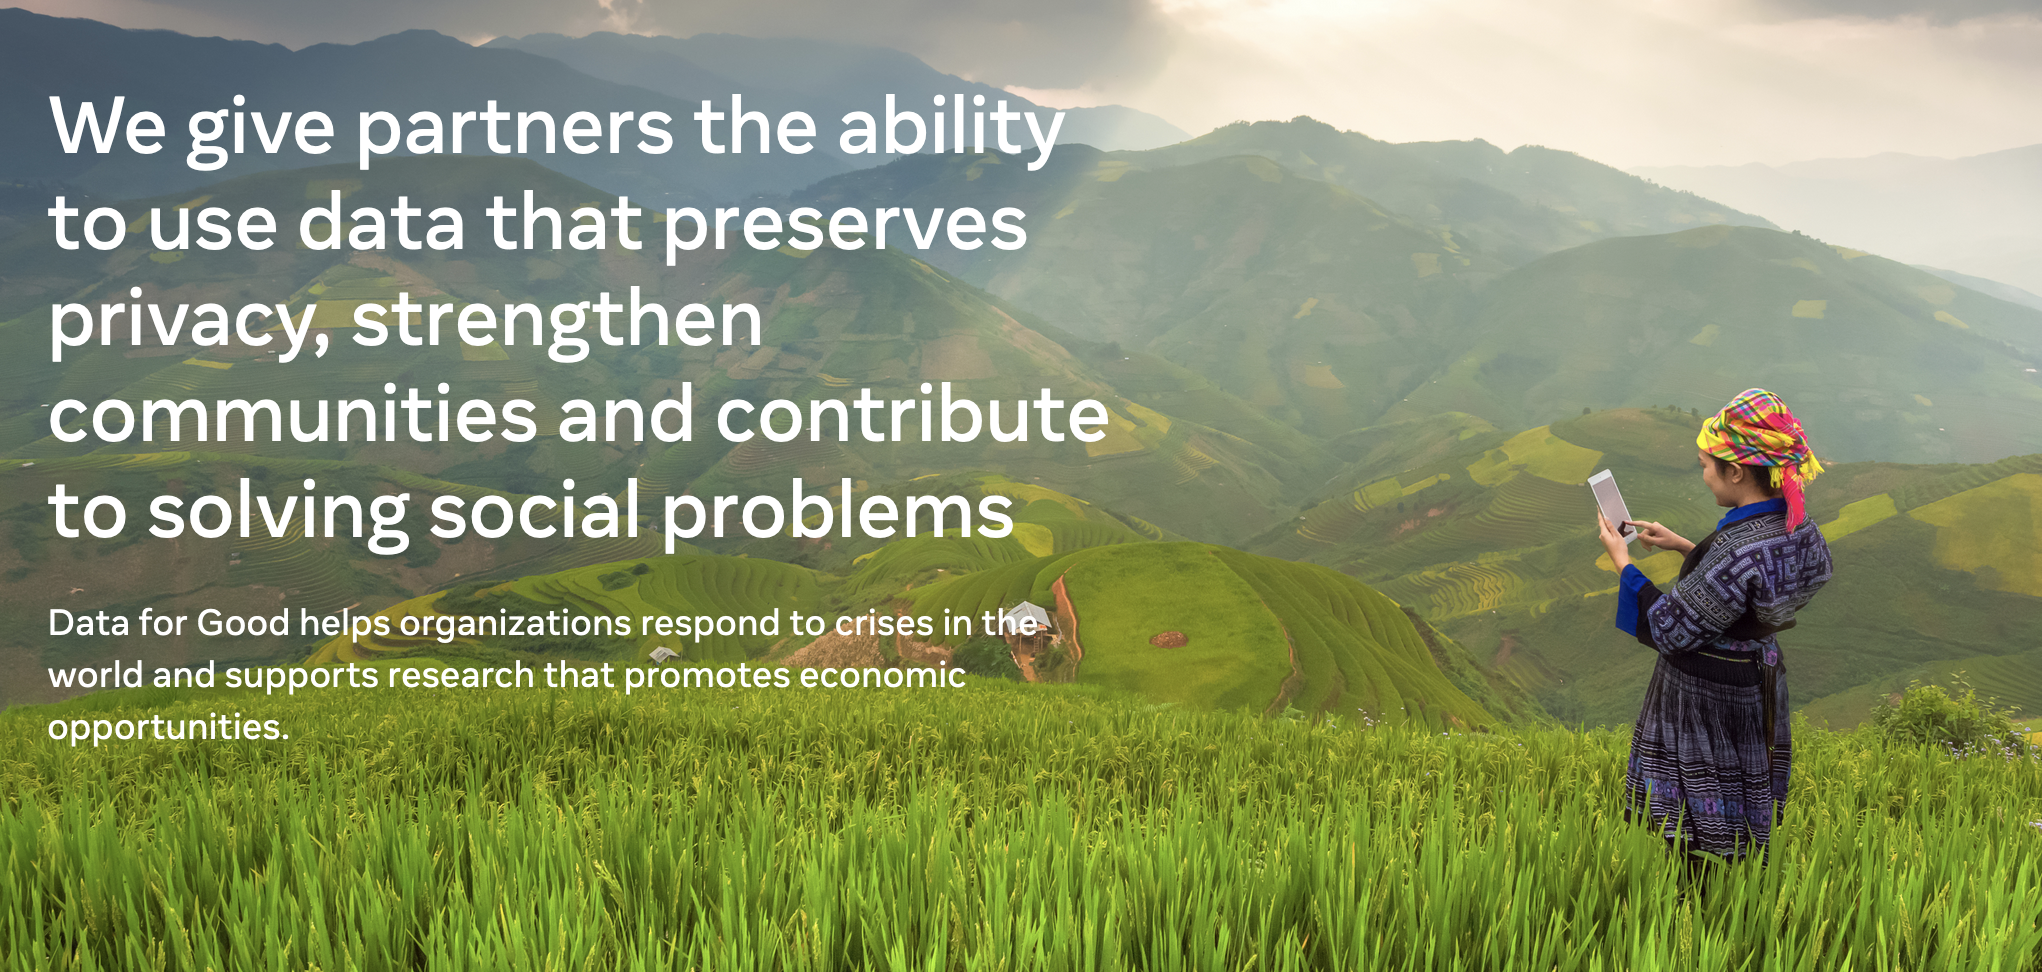

Facebook Mobility Data
How is the data obtained?
- Mobile devices with a Meta app installed
- Meta/Facebook users location ➡️ latitude and longitude at a given time.
- Measures applied to the data to ensure privacy and anonymity.

Facebook Mobility Data
What data do researchers receive?
Mapped using a Bing tile architecture ➡️ users are assigned to individual tiles.
Data is provided in 8-hour time periods ( 0hs - 8hs / 8hs - 16hs / 16hs - 0hs ).
Variable
percent_change: relative change in mobility compared to a baseline period.

Facebook Mobility Data
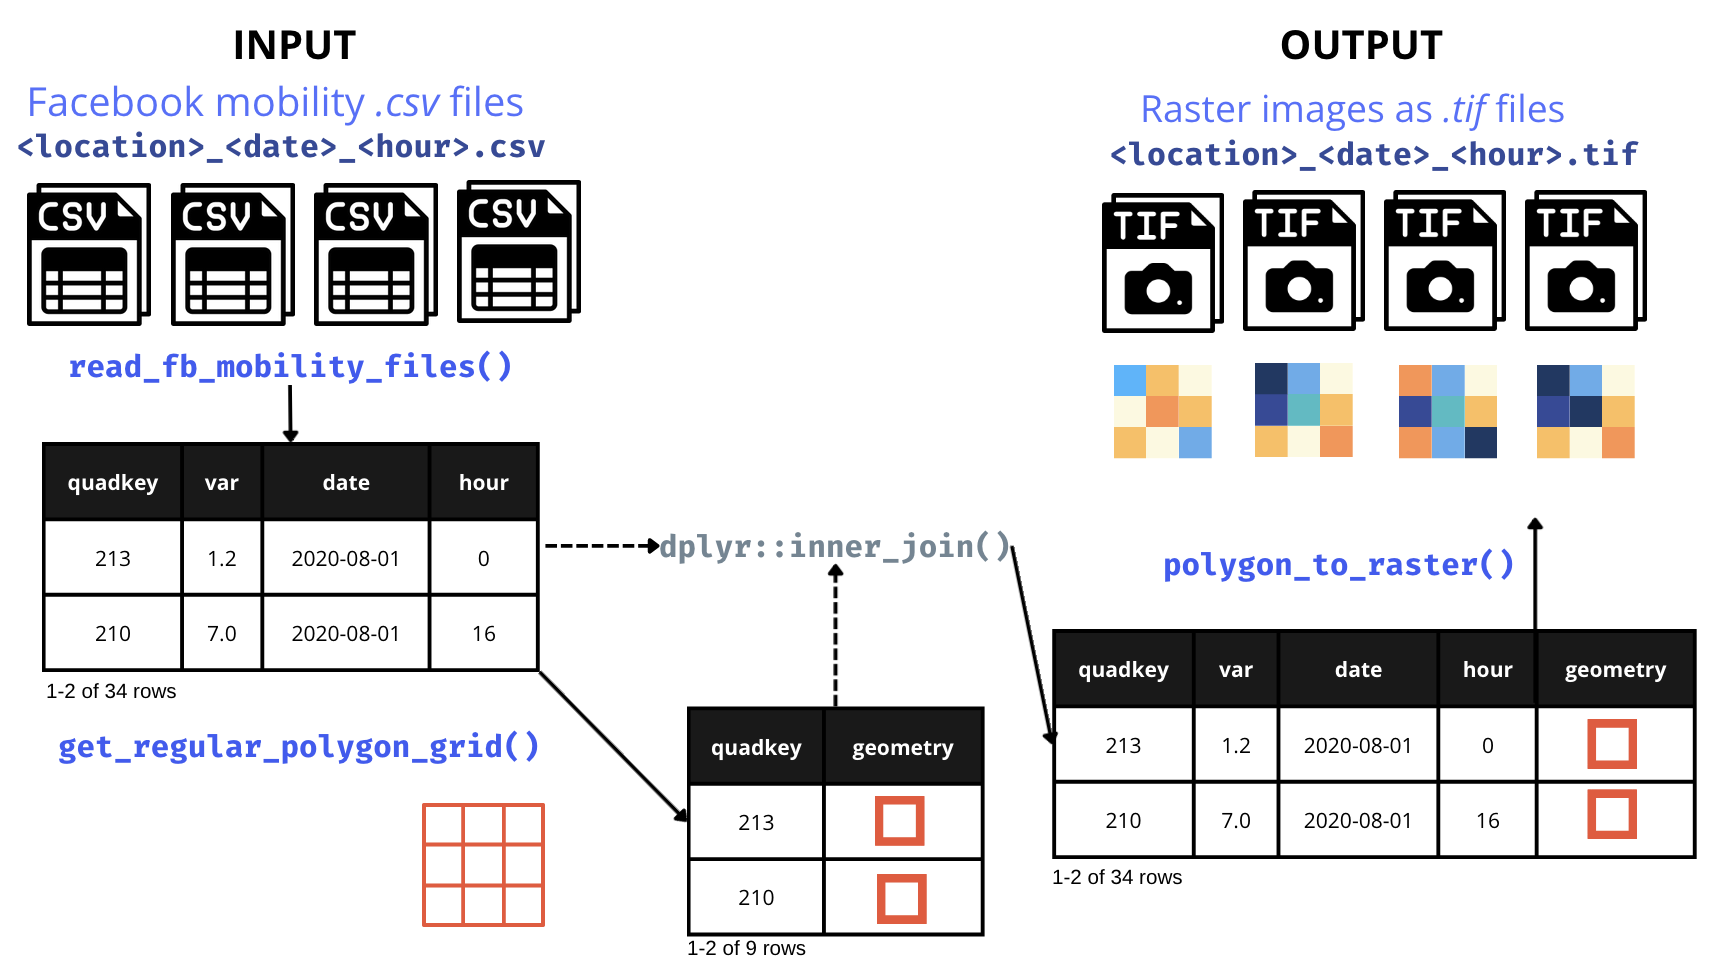
From QuadKeys to raster images
The tiles can have different sizes, producing maps with varying level of detail.
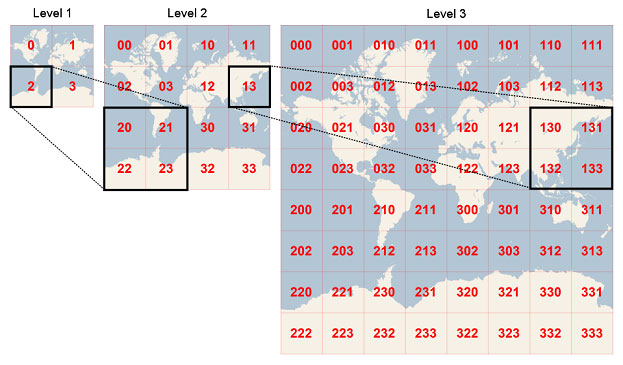
QuadKeys represent a location on a map by encoding its hierarchical spatial position as a sequence of characters.
Facebook Mobility Data
From QuadKeys to raster images
Facebook Mobility Data
1. From a QuadKey to a simple features dataframe
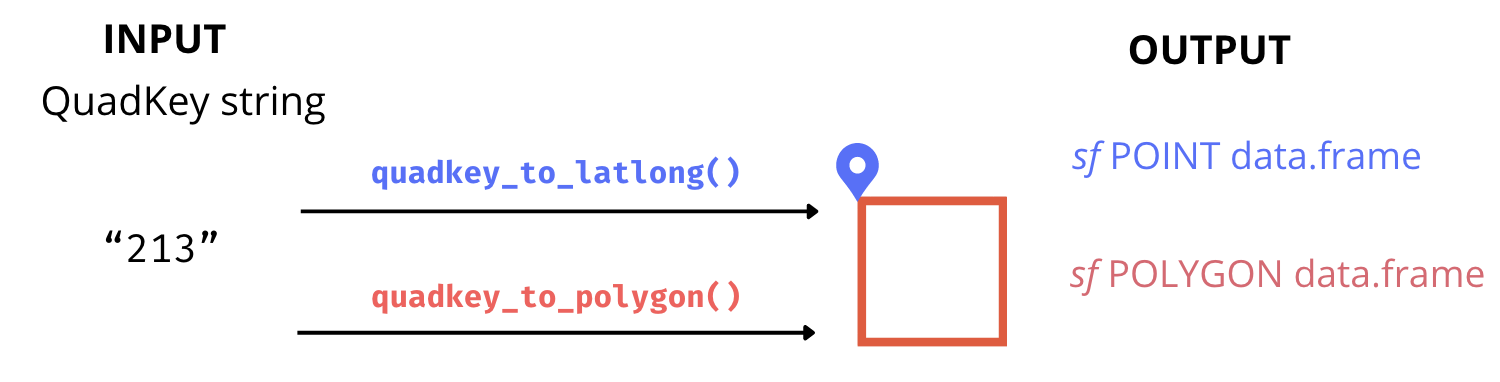
Facebook Mobility Data
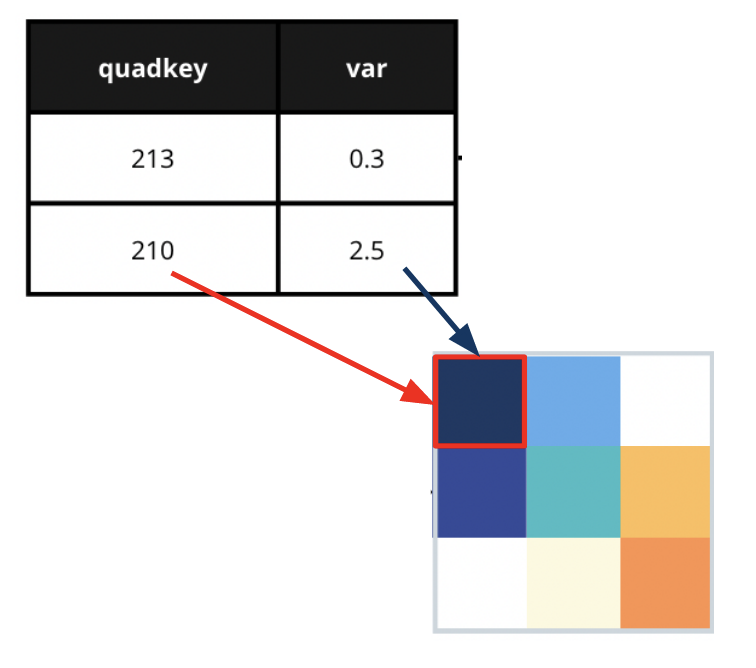
2. Generating a Raster Image from Quadkey-Identified Data
Facebook Mobility Data
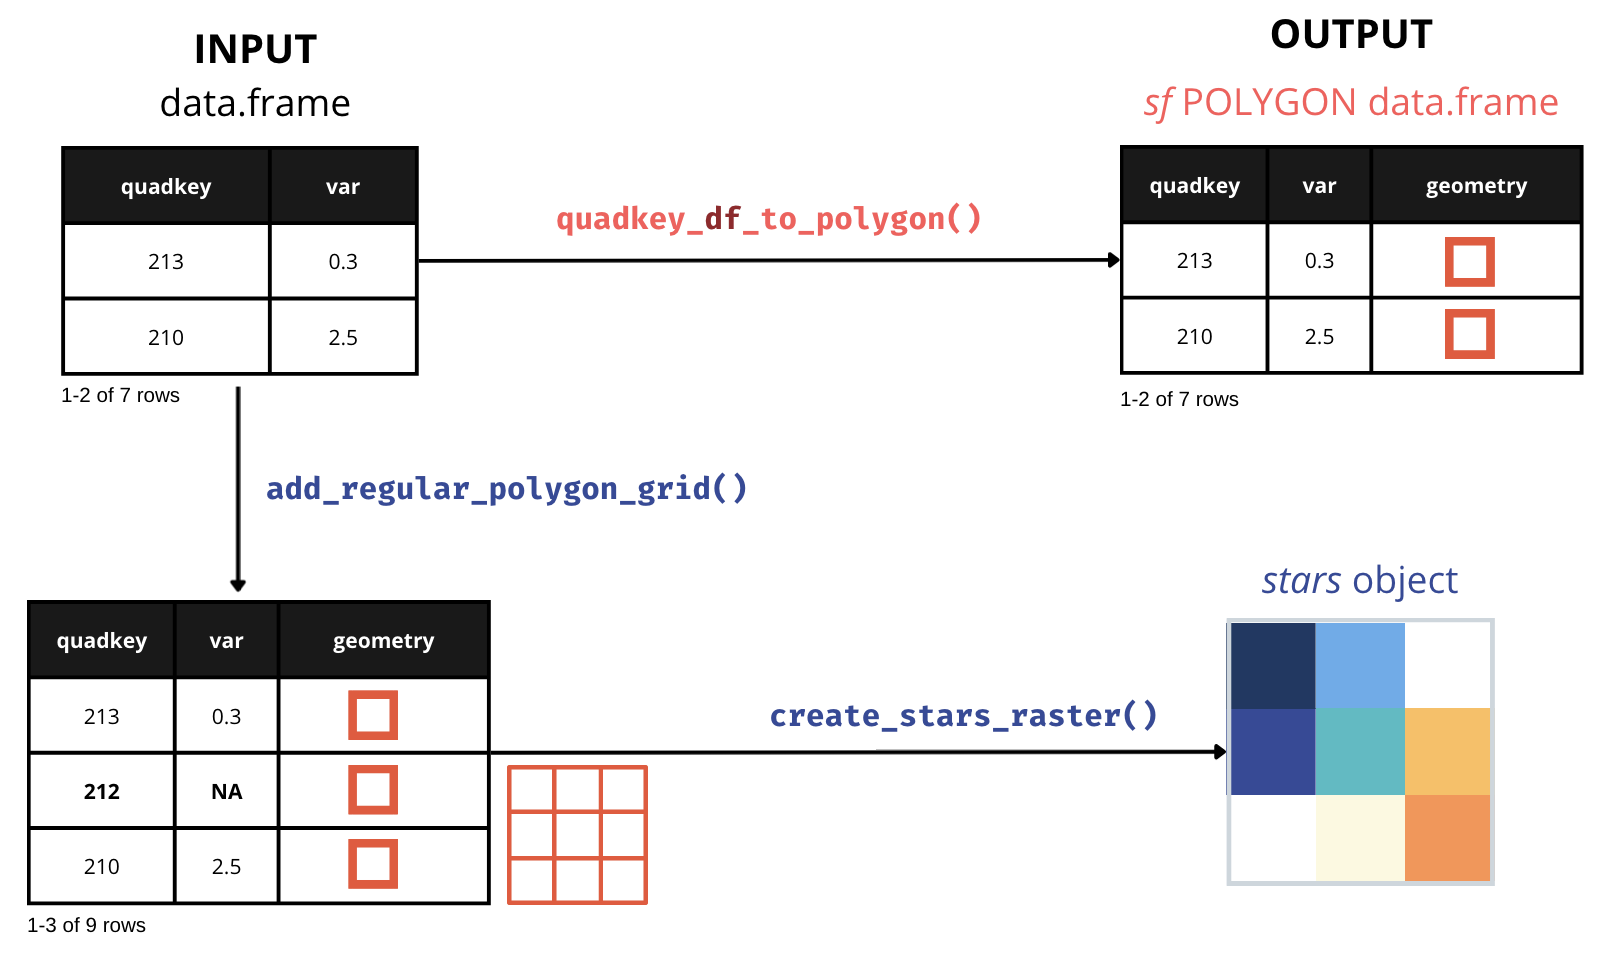
3. Converting Facebook Mobility QuadKey-identified Datasets into Raster Files
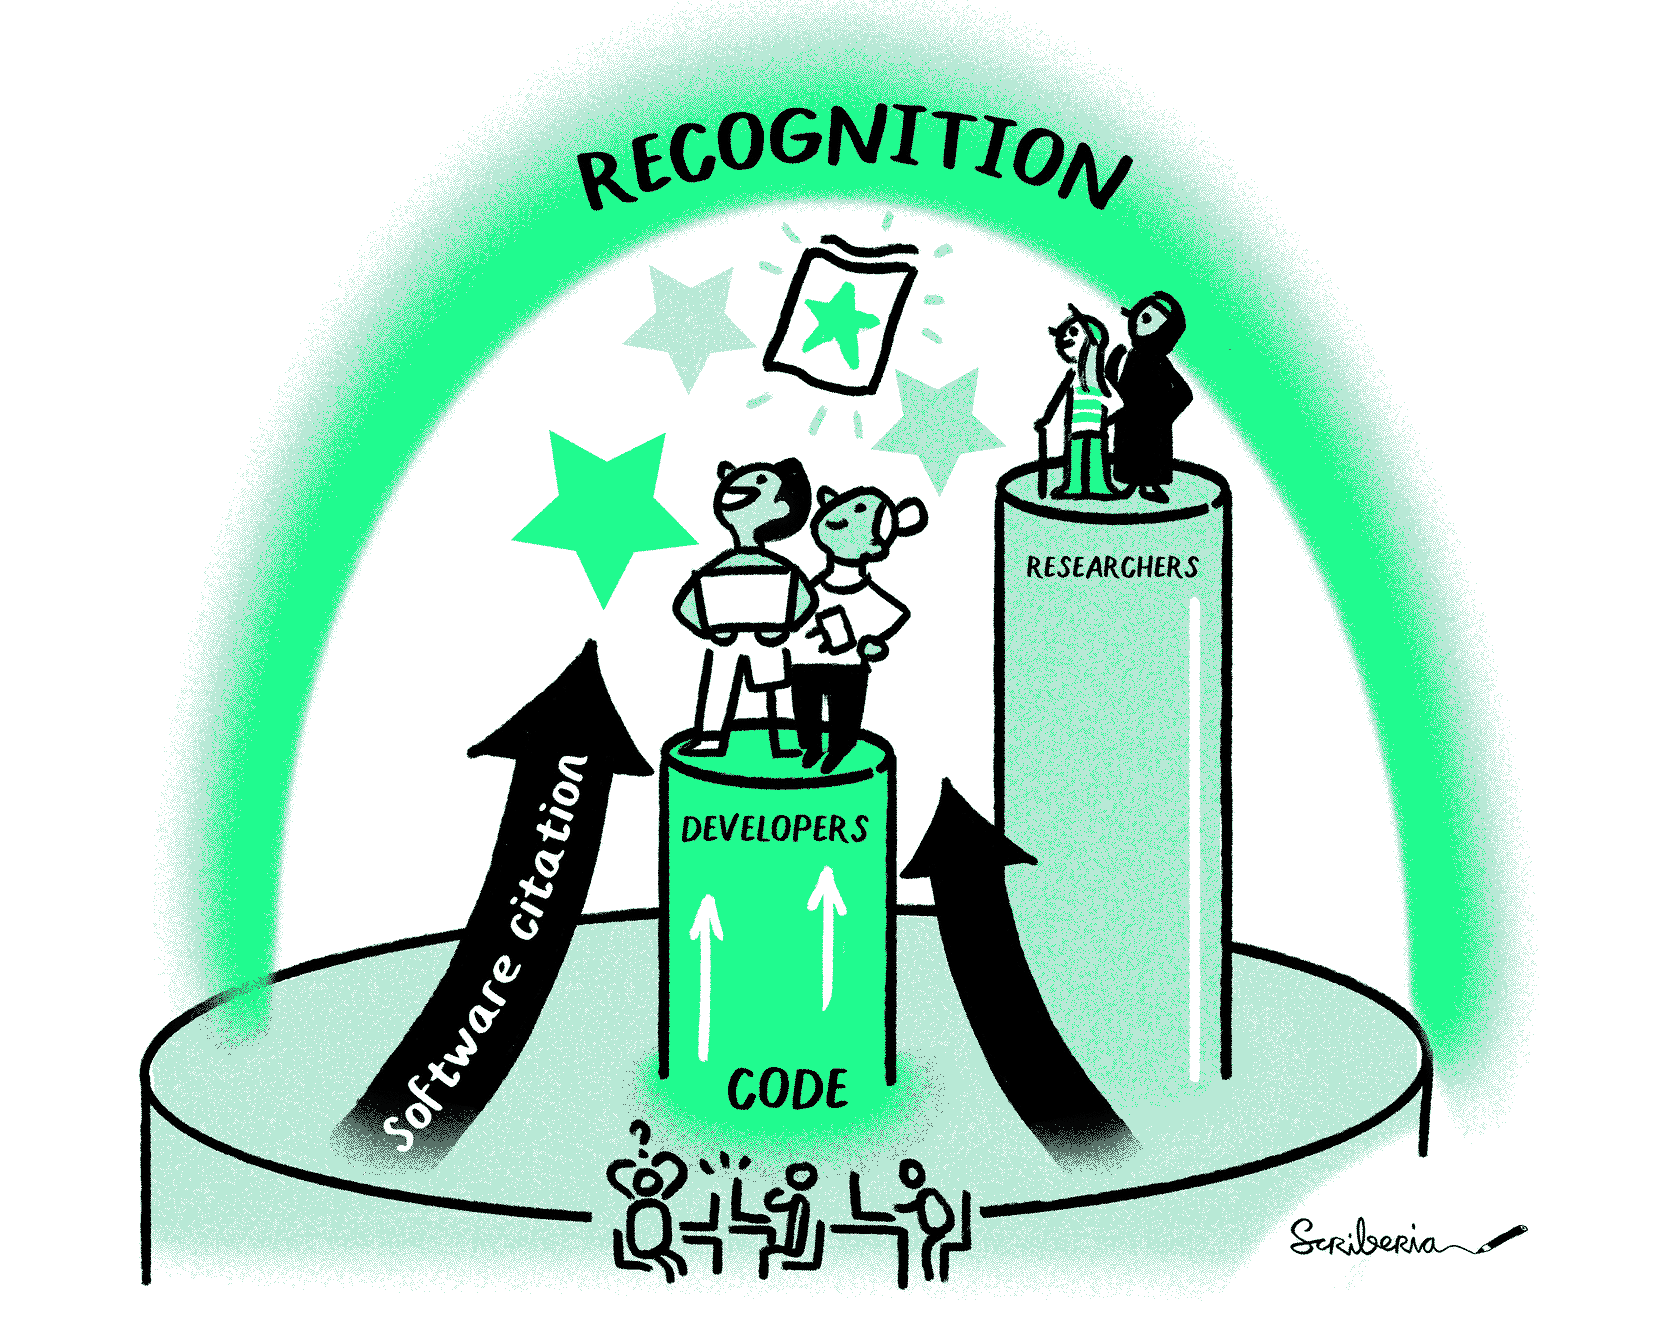
Why create a software package?
- Makes it easier to reuse functions.
- Improves code quality (i.g. tests, documentation).
- Ensures computational reproducibility.
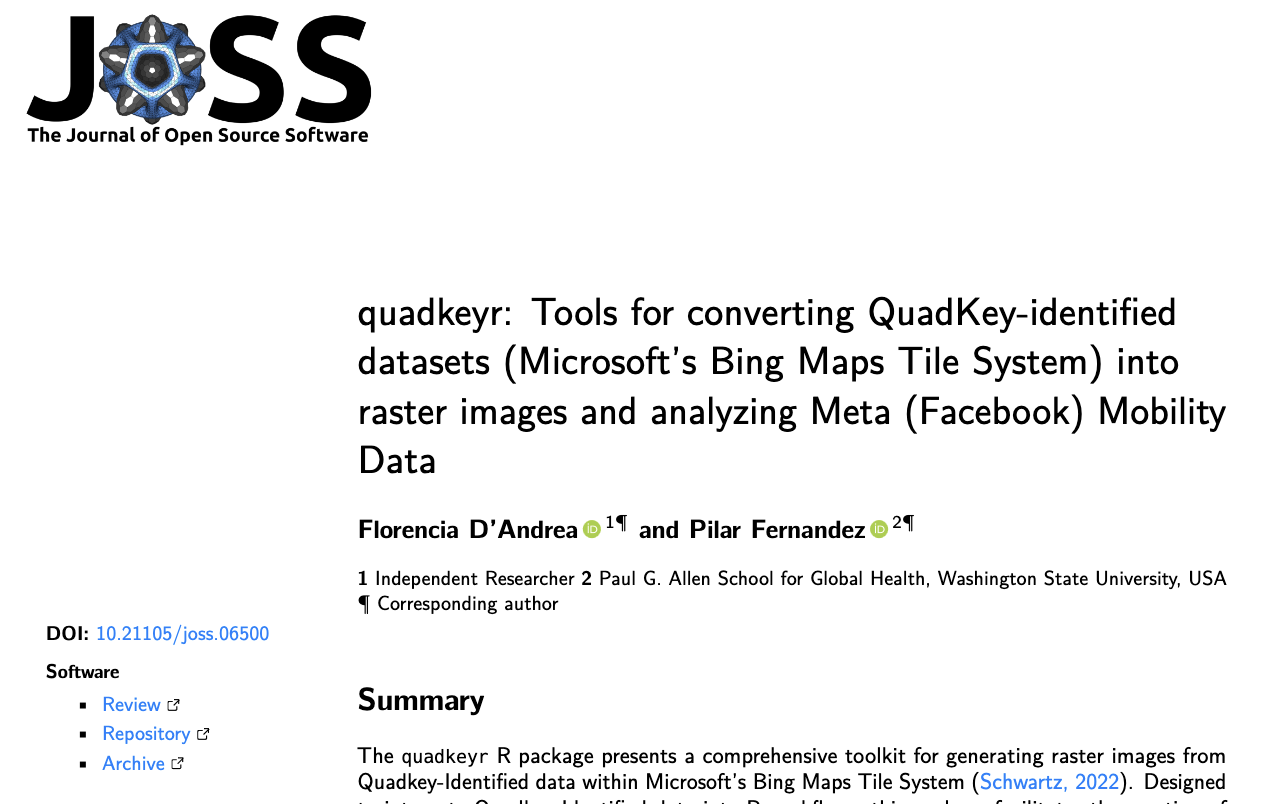
R package: quadkeyr
rOpenSci peer-review
Transparent, constructive, non adversarial and open review process

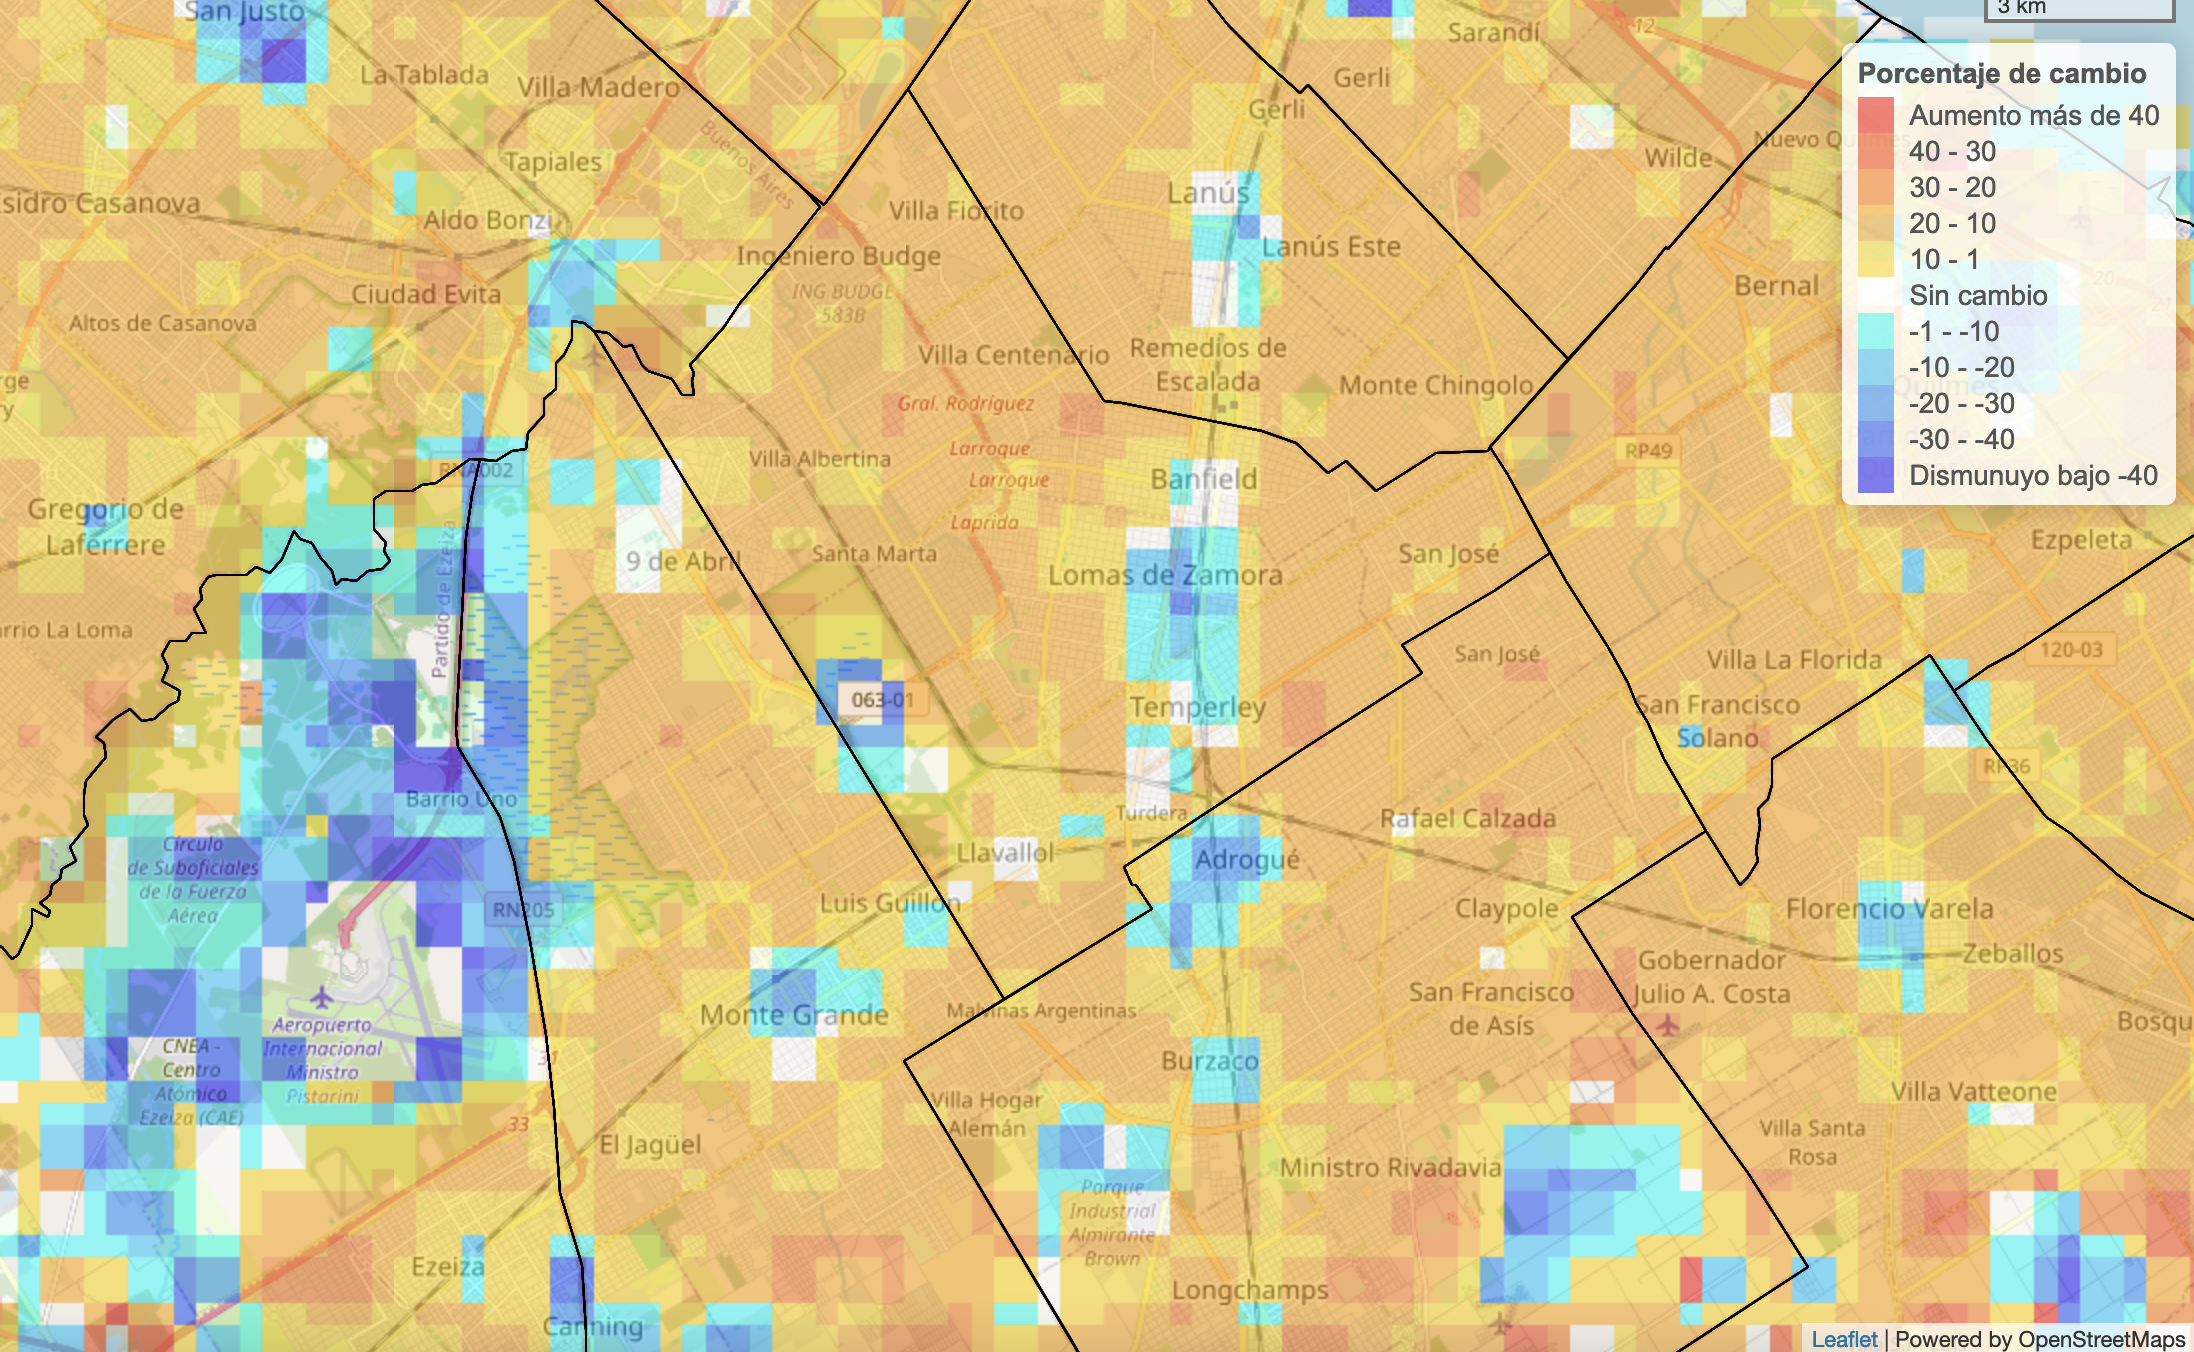
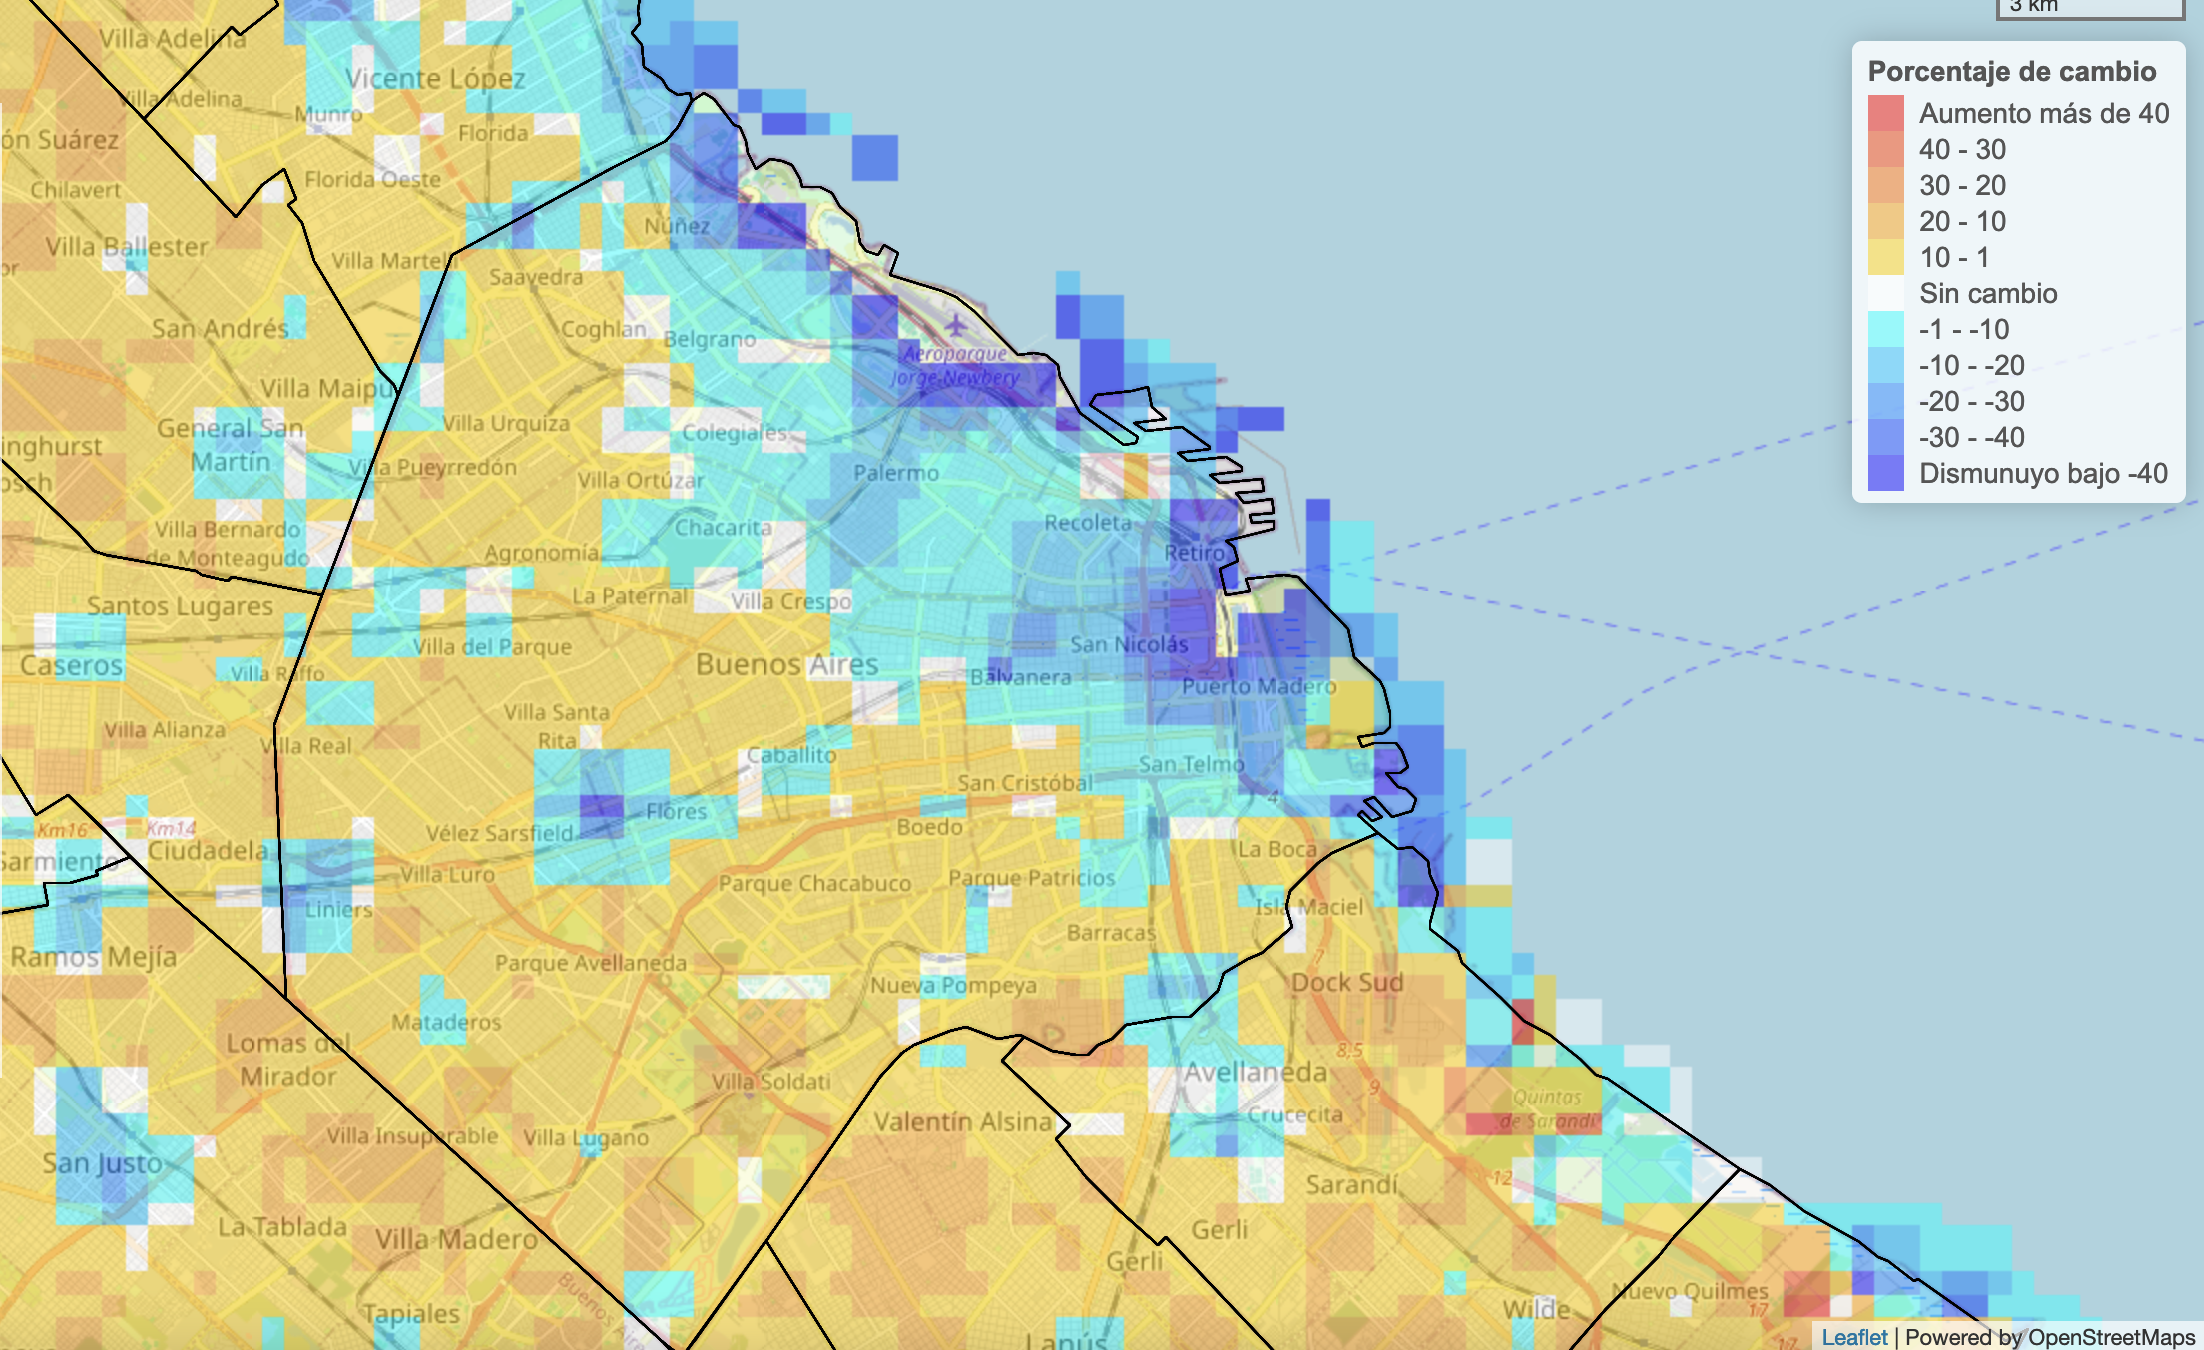
GeoCovidAR
Integrate city mobility information with daily reported COVID-19 cases
![]()
Tab 1: General exploration
Tab 2: Departments
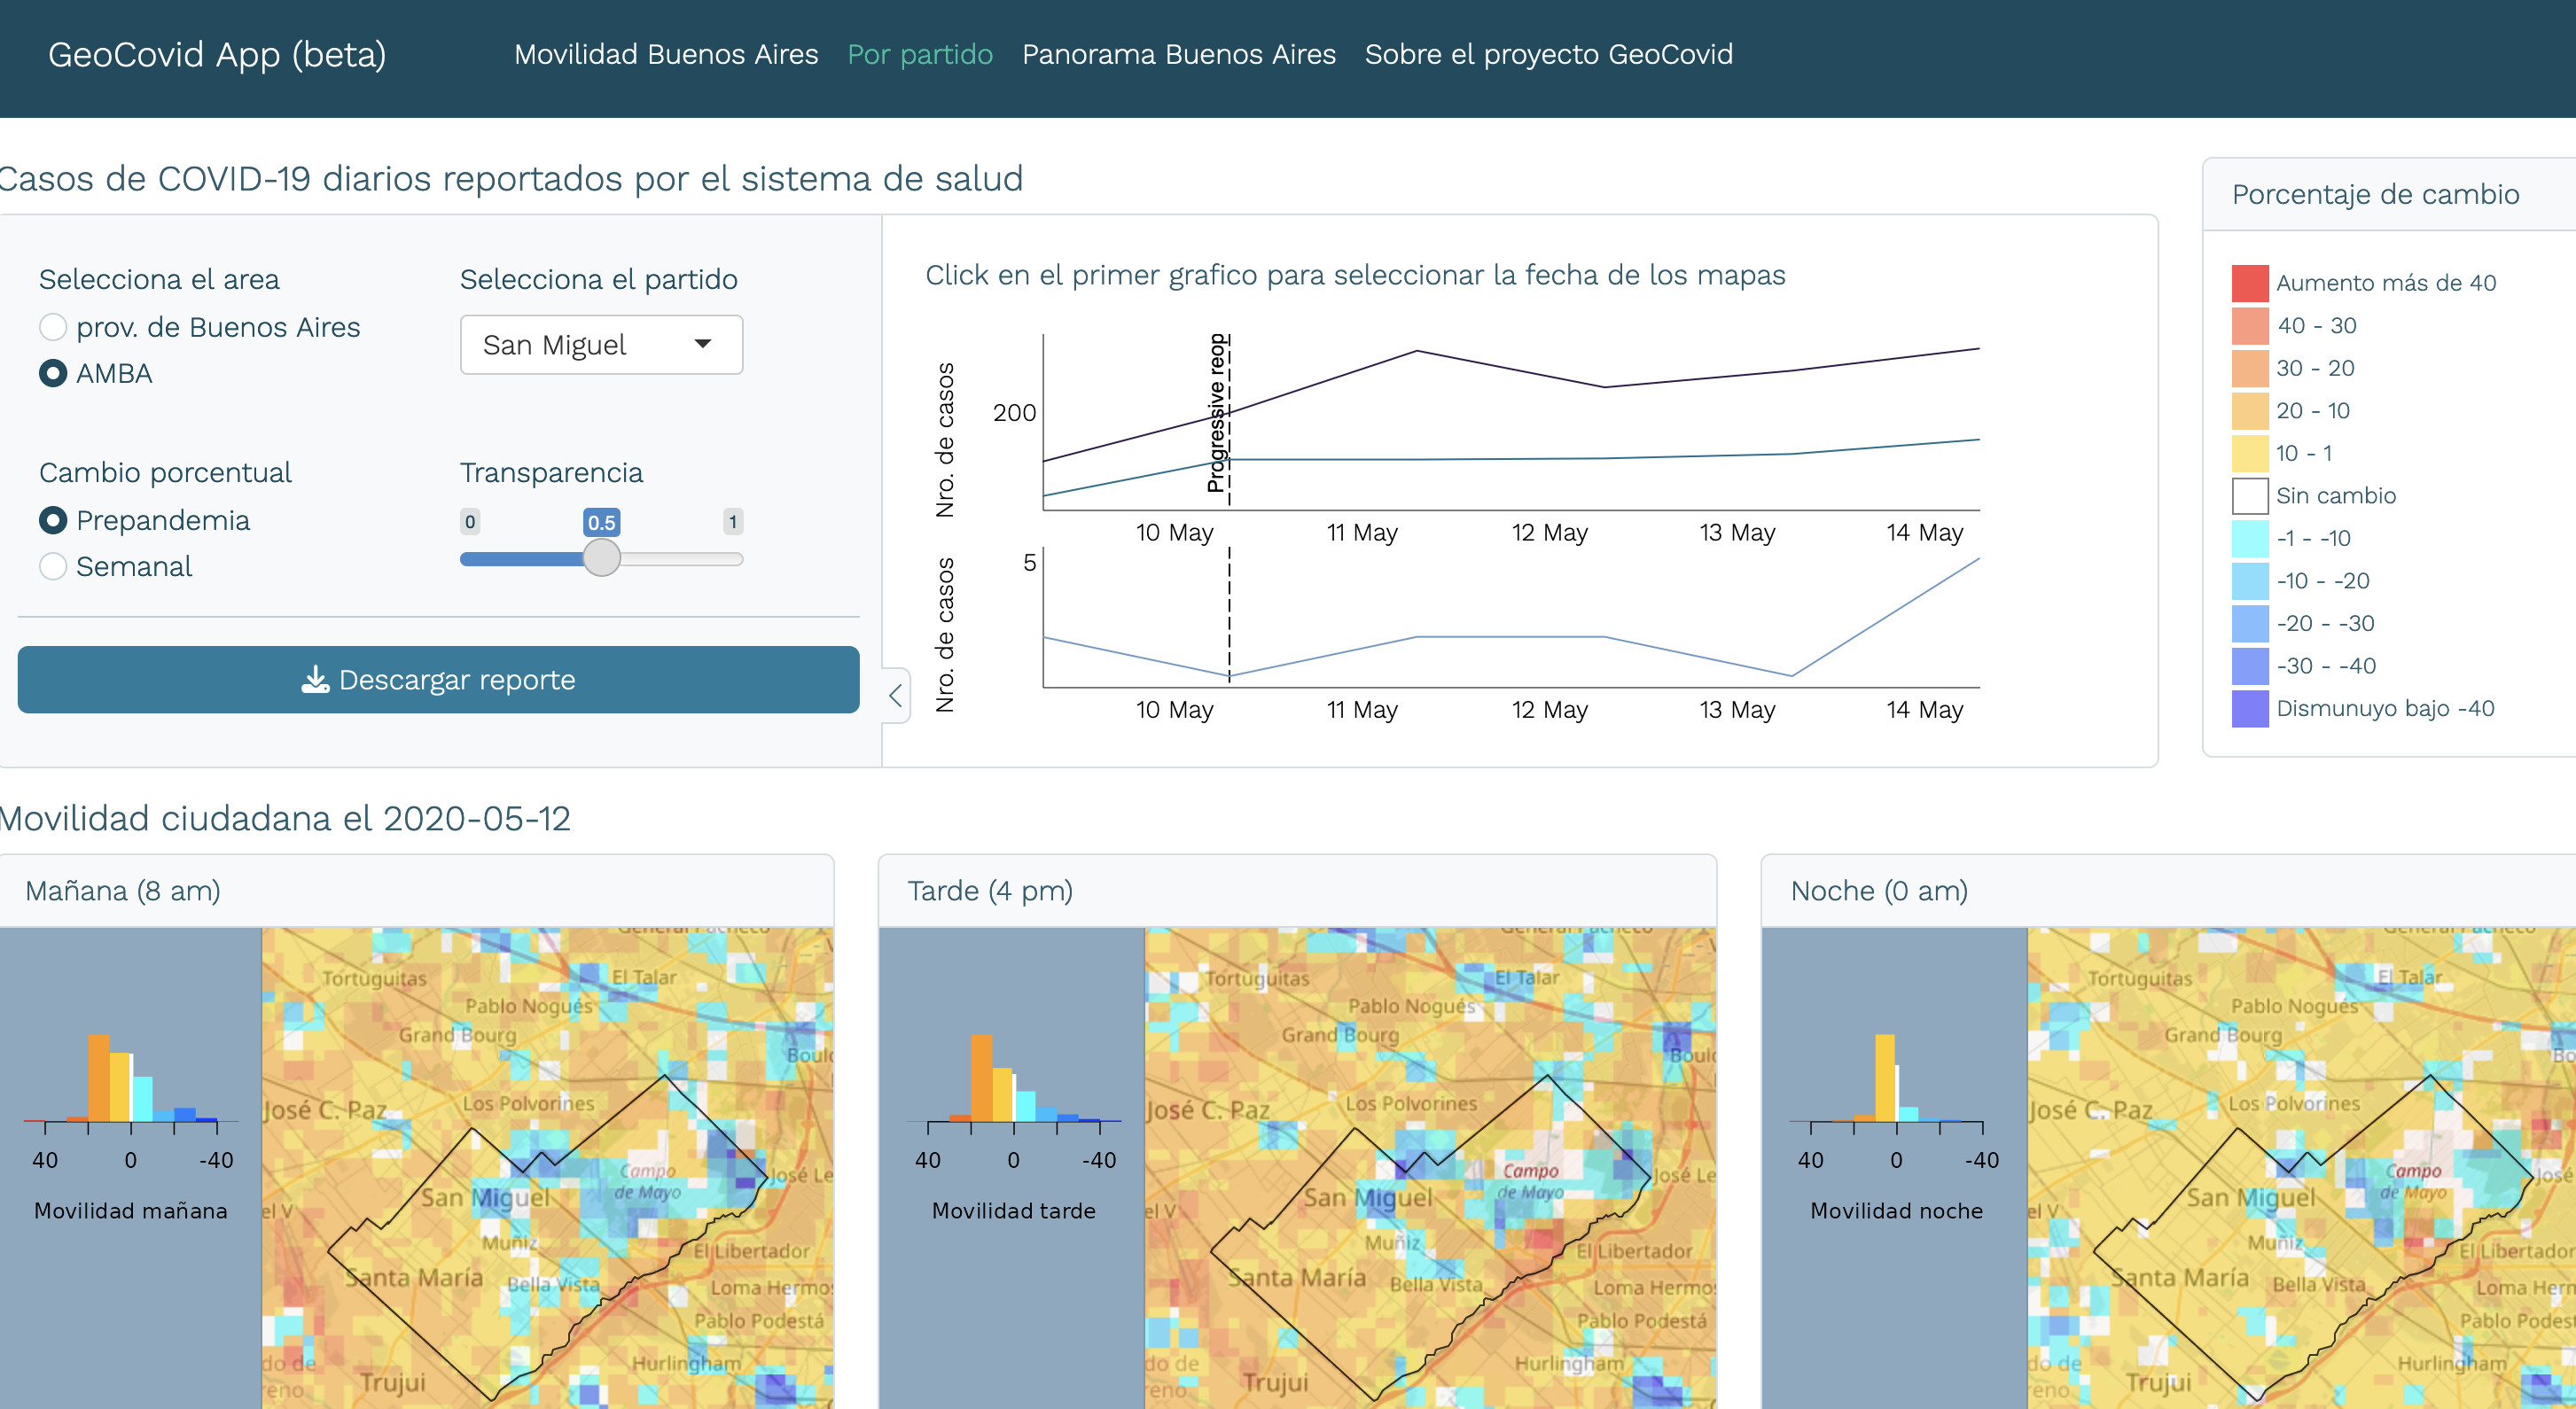
Tab 2
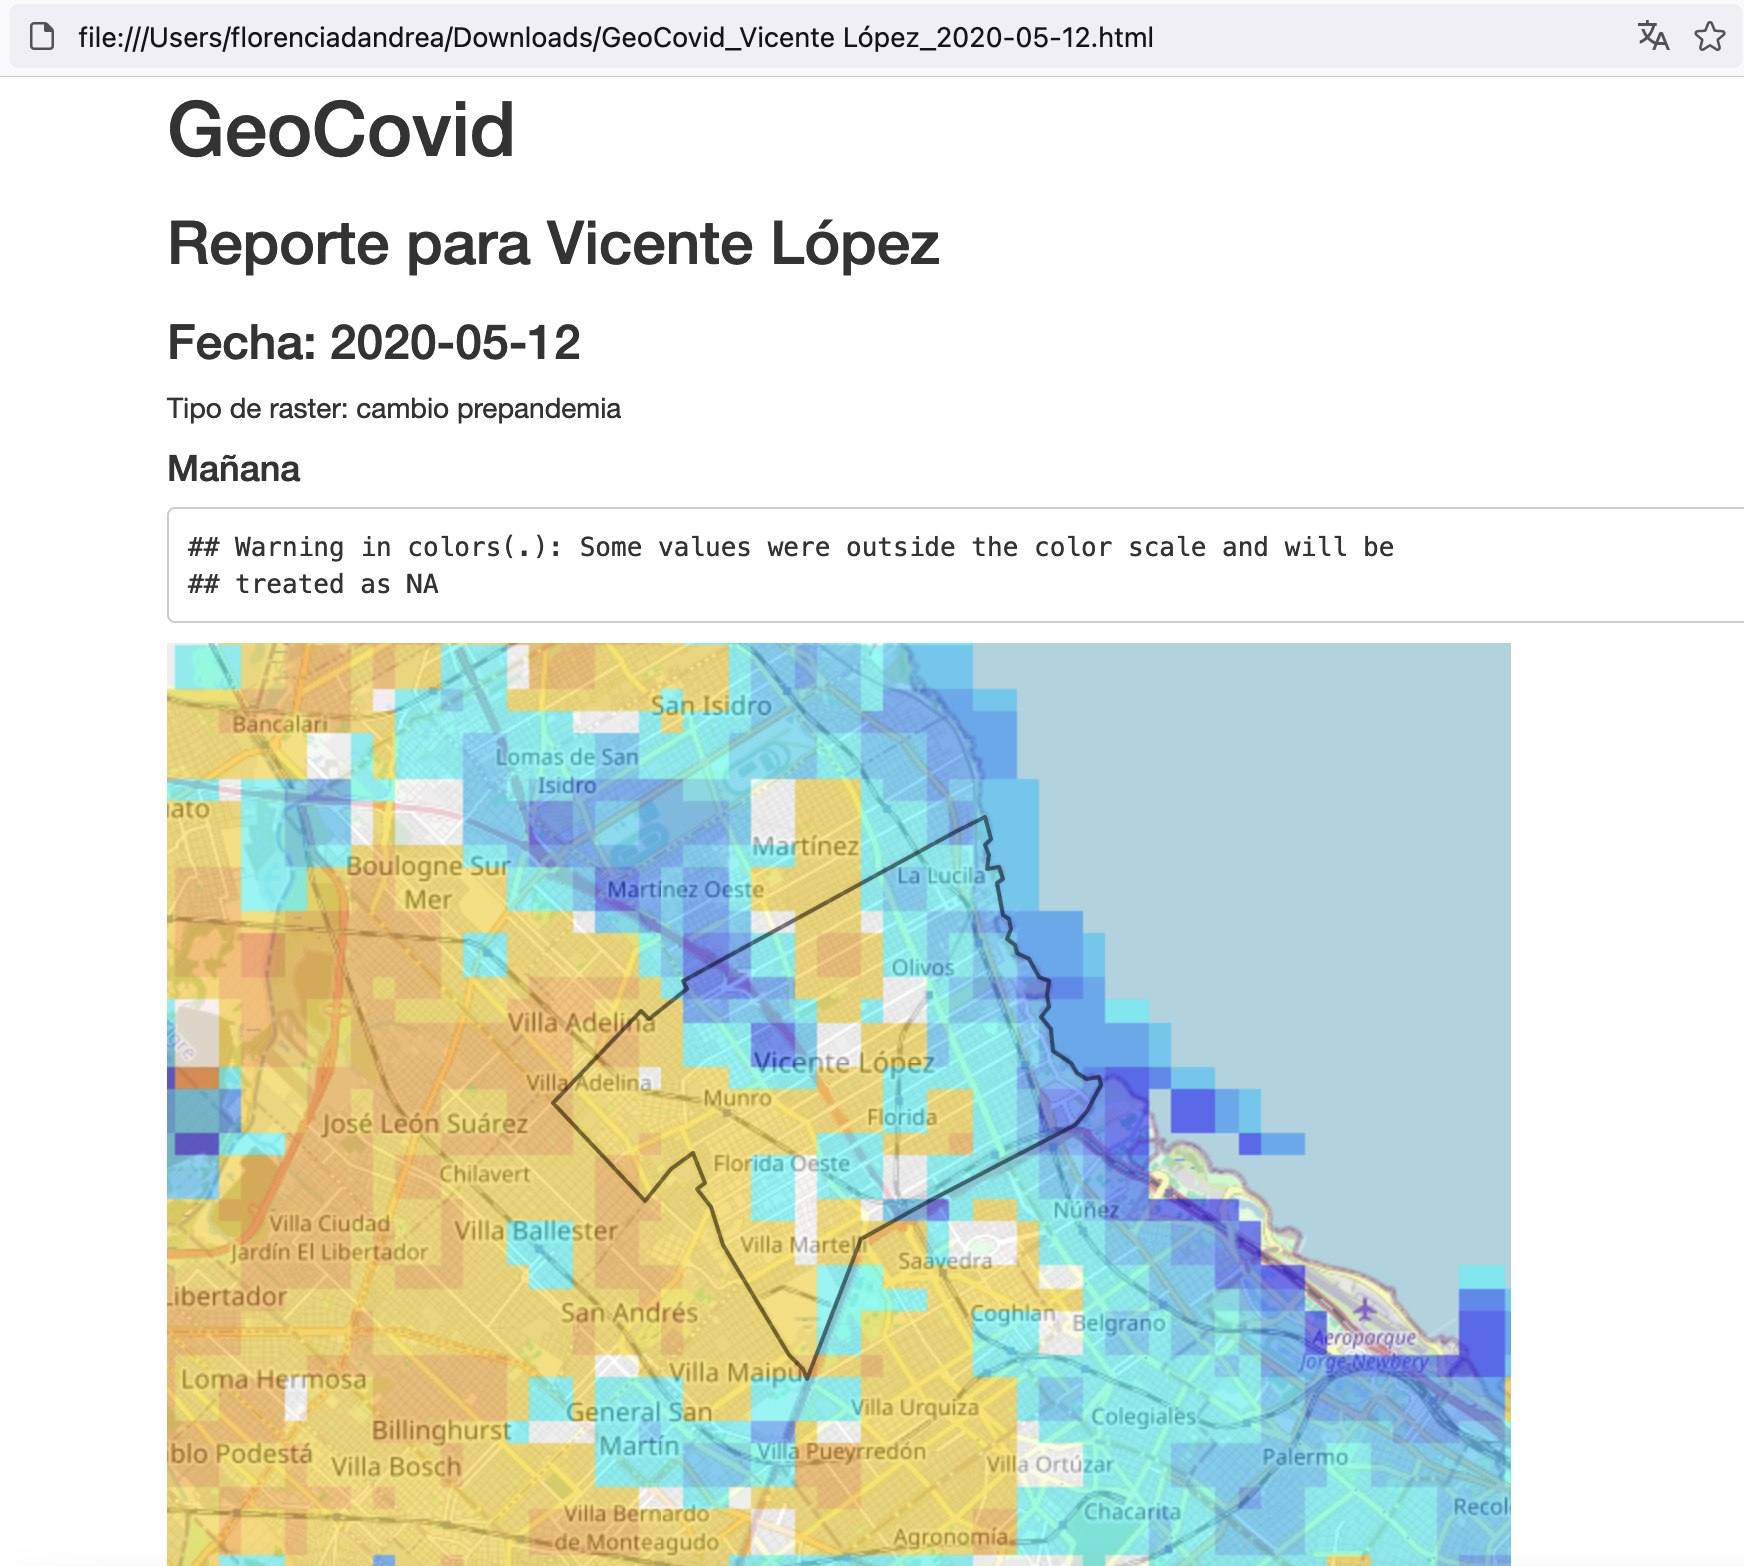
You can download a report
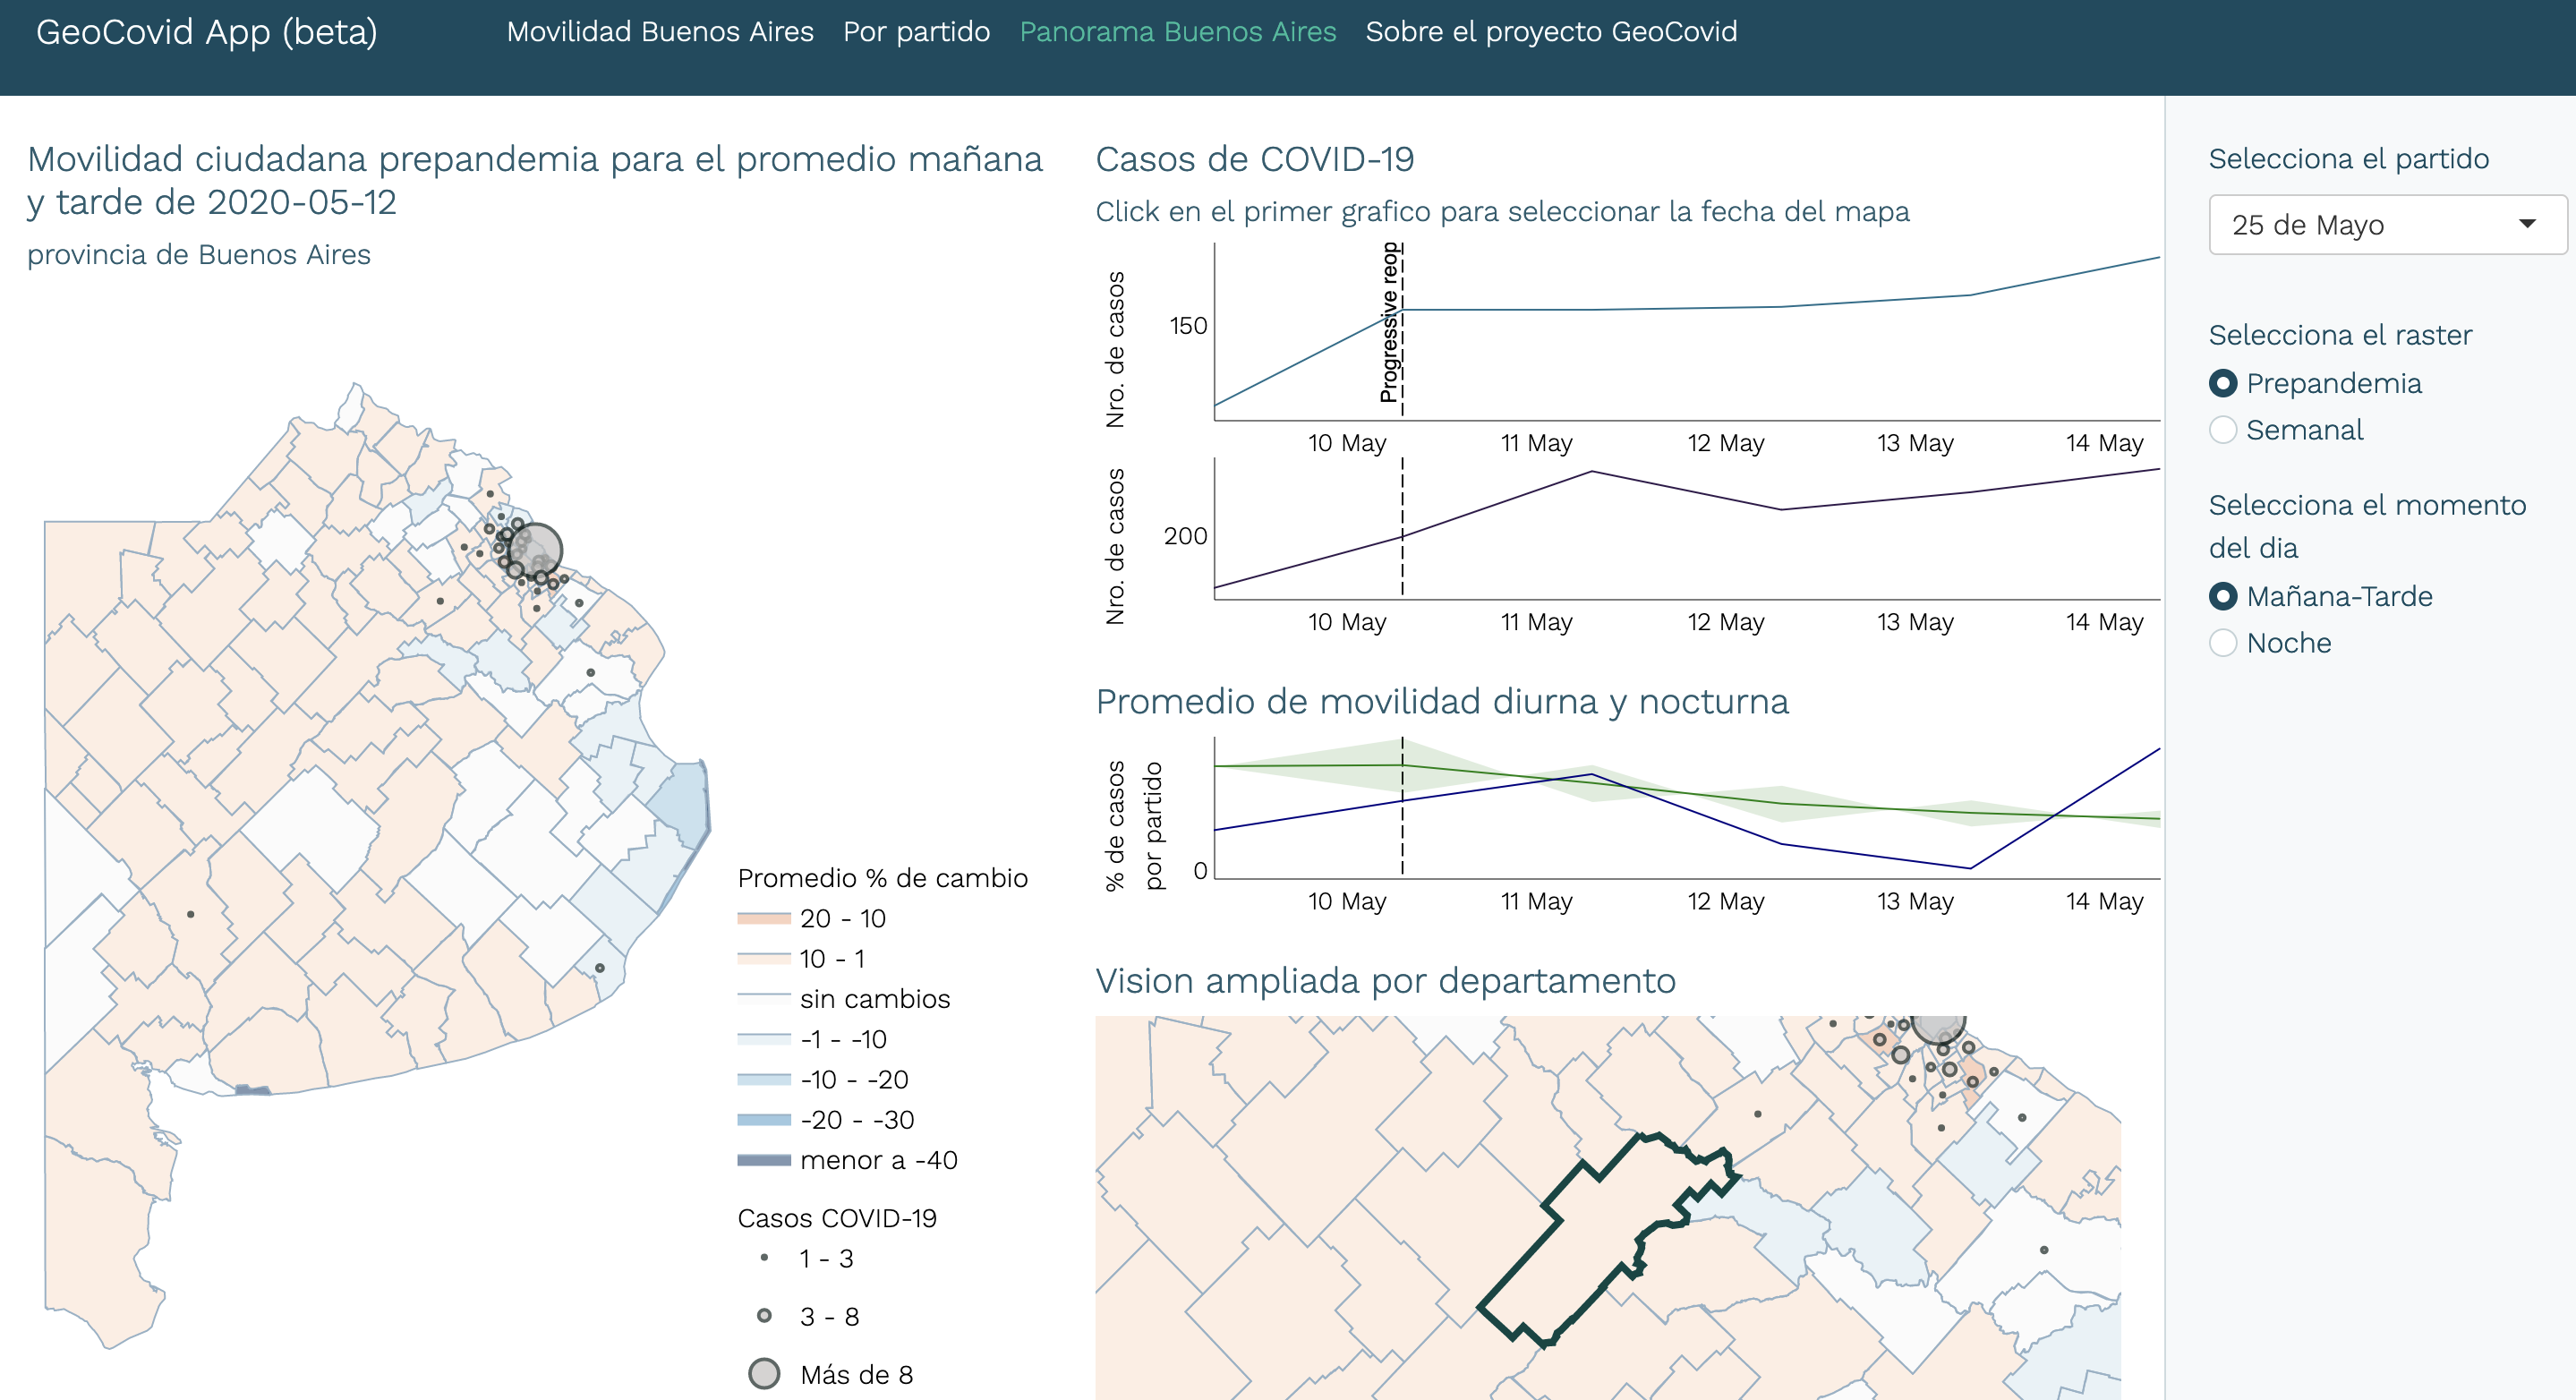
Tab 3: Average percent change by department and COVID-19 cases
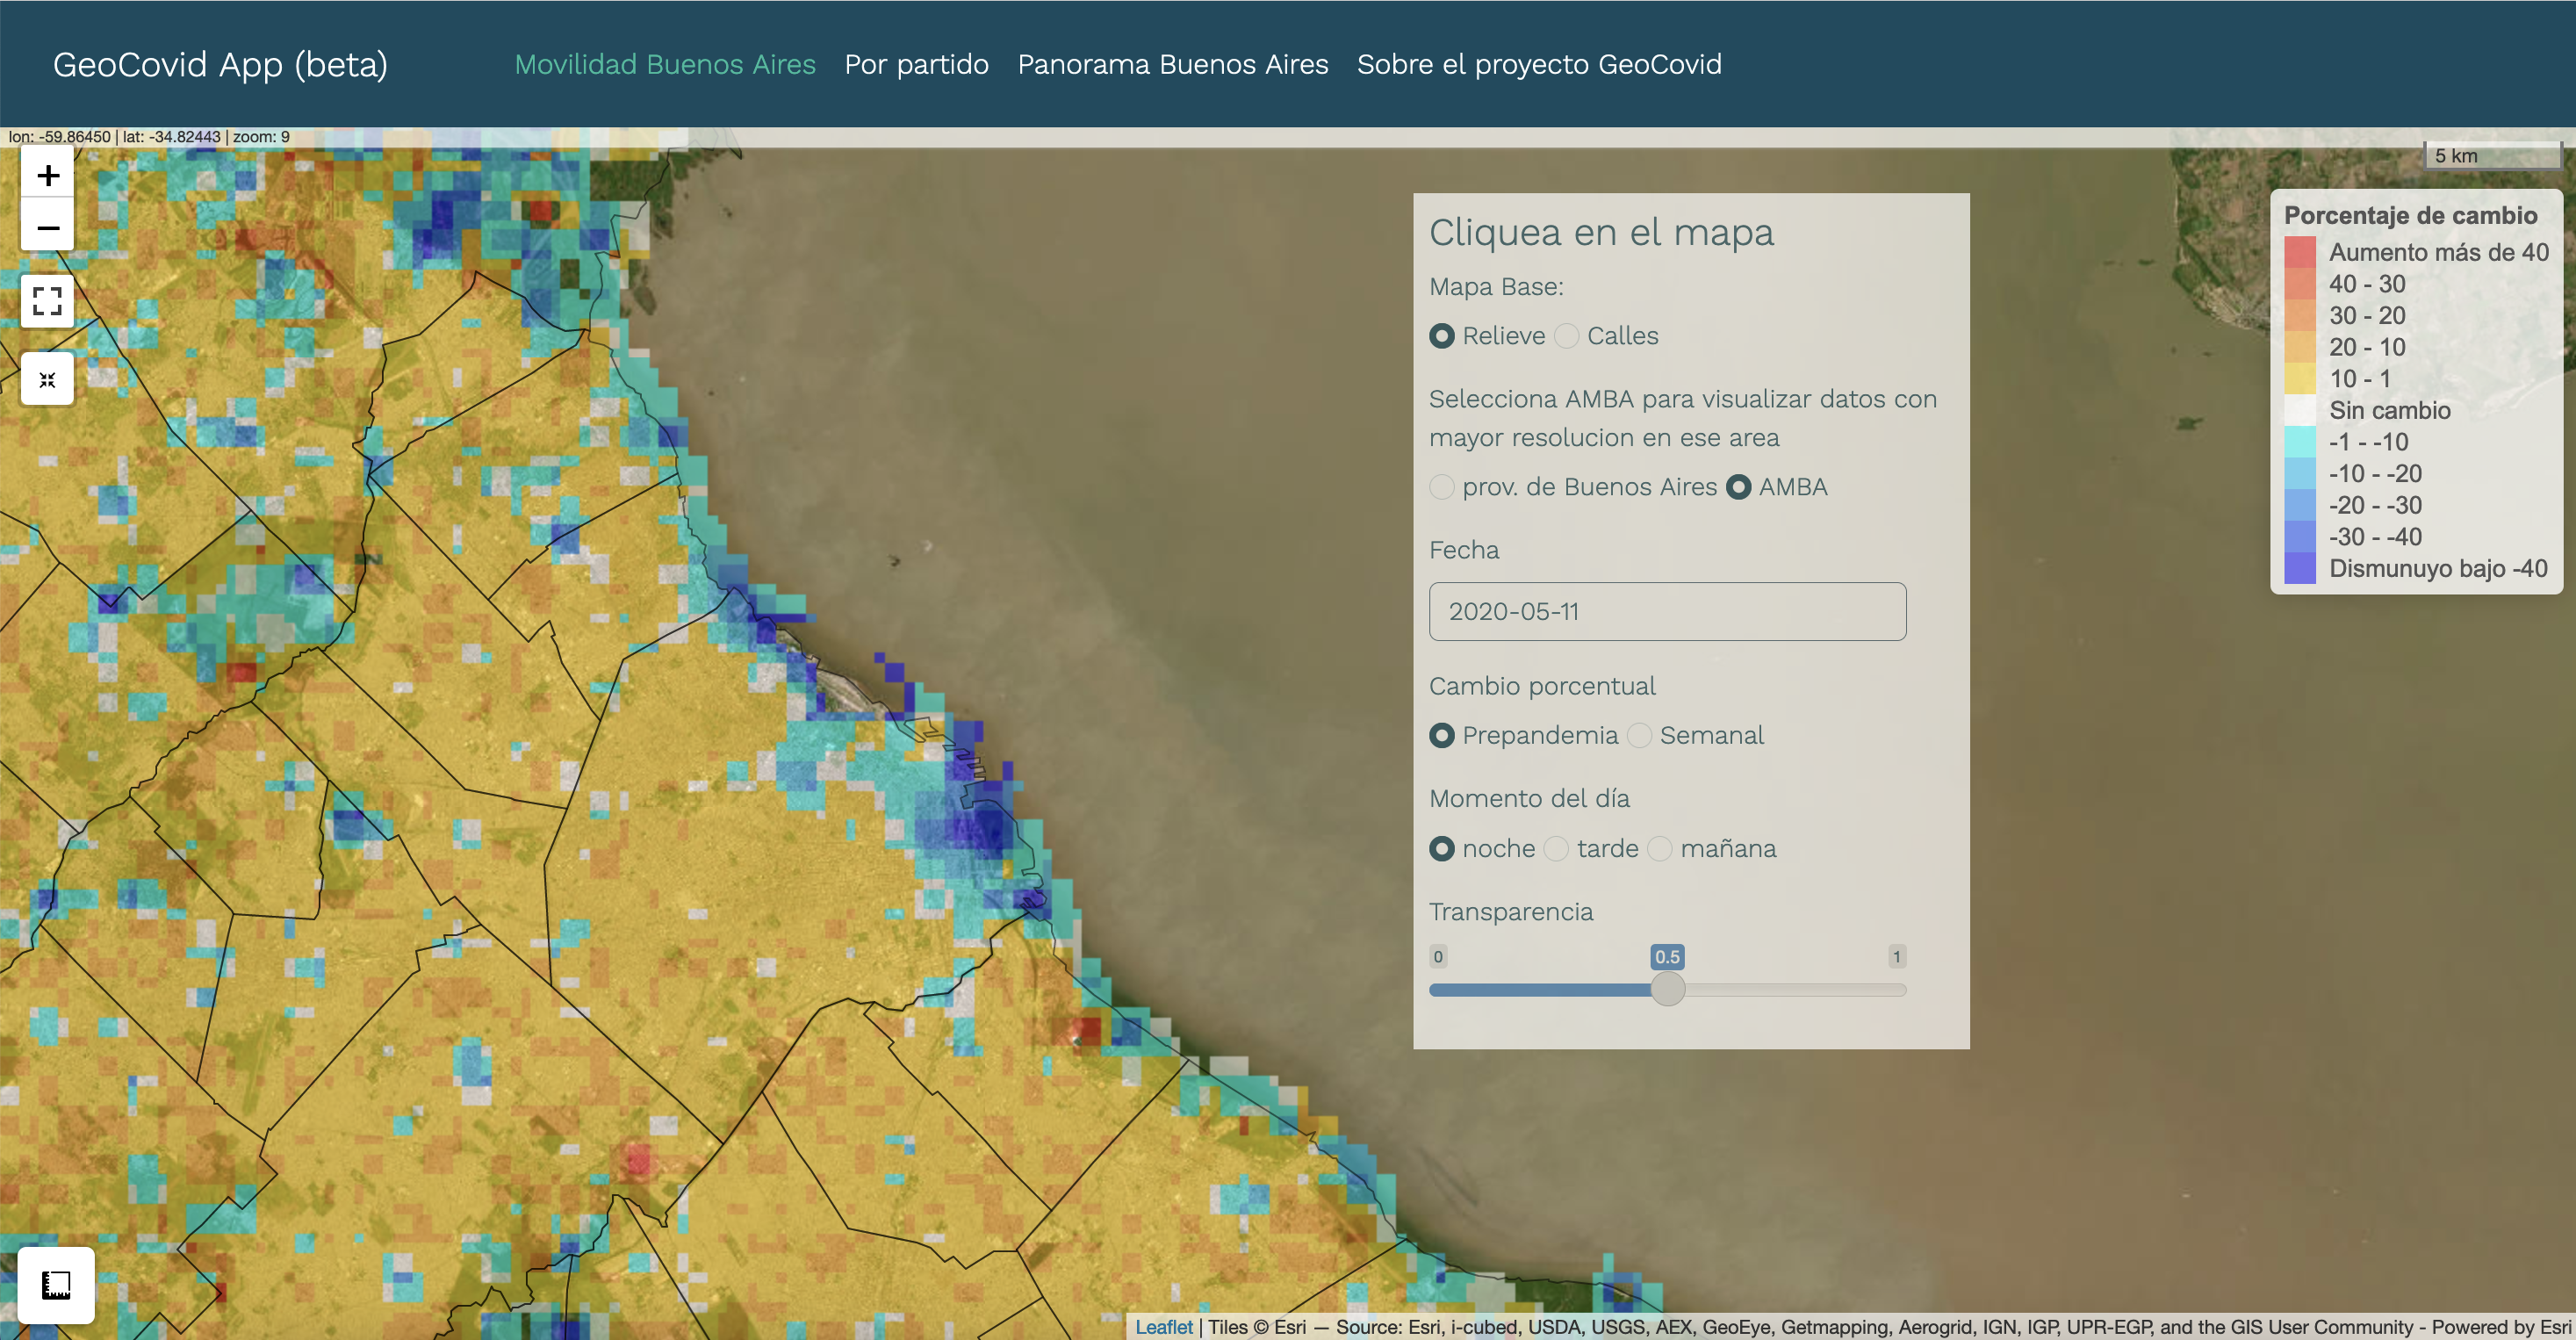
Where lives the project data?
Website: GeoCovid Buenos Aires
Conclusions
quadkeyr and GeoCovidAR are flexible tools adaptable to different scenarios
Funding


![]()